
Last updated · EIA data through July 2026
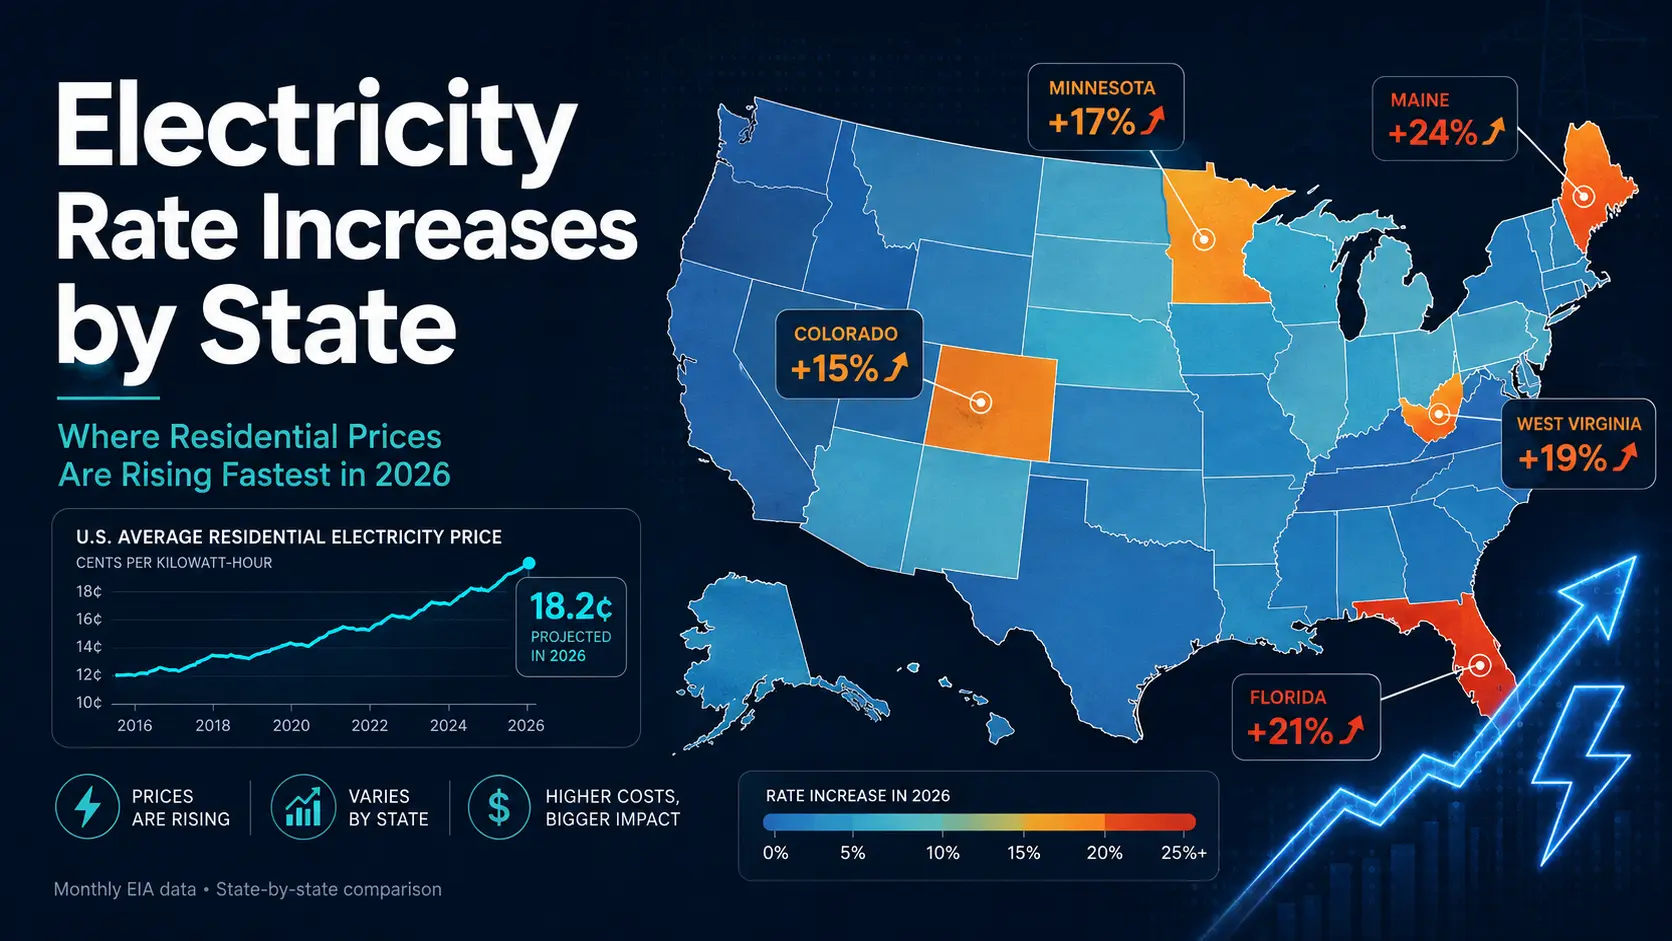
Every month, Billora Hub imports the latest residential electricity data from the U.S. Energy Information Administration. When I looked through the latest update, what stood out wasn’t just that electricity was getting more expensive nationally. It was how different the story looked from one state to another.
Some states saw sharp year-over-year increases. Others barely moved. A few actually became cheaper.
This page tracks those differences using fresh EIA data and updates as new monthly figures become available.
Quick answer: The latest complete EIA data available on Billora is from July 2026. The U.S. average residential electricity price changed by +4.9% compared with the same month one year earlier. The current national residential average is 18.3¢/kWh.
One terminology note before getting into the rankings: people commonly search for “electricity rates,” but the EIA data used here is technically an average retail electricity price. EIA calculates it from electricity revenue and sales, so it should not be confused with the exact tariff offered by a particular utility or electricity plan.
Electricity Rate Increases by State: 2026 Ranking
The table below compares the latest complete month of EIA residential electricity data with the same calendar month one year earlier.
That matters. Comparing May with April, for example, could mix a real price change with normal seasonal variation. Billora instead compares like with like: the same month, one year apart, across every state.
The final column translates the change in electricity price into an estimated monthly dollar impact for the same household using the same amount of electricity. It is designed to isolate the effect of the price change itself.
| # | State | Current Rate | Est. Monthly Bill | Rate Change | Est. Bill Change |
|---|---|---|---|---|---|
| 1 | Hawaii HI | 48.0¢/kWh | $484 | +22.0% | +$87/mo |
| 2 | New Hampshire NH | 26.6¢/kWh | $268 | +16.7% | +$38/mo |
| 3 | Maine ME | 32.4¢/kWh | $327 | +15.8% | +$45/mo |
| 4 | New York NY | 29.9¢/kWh | $301 | +14.0% | +$37/mo |
| 5 | Maryland MD | 21.4¢/kWh | $216 | +13.7% | +$26/mo |
| 6 | North Carolina NC | 15.2¢/kWh | $153 | +13.4% | +$18/mo |
| 7 | Michigan MI | 23.1¢/kWh | $232 | +12.2% | +$25/mo |
| 8 | Ohio OH | 19.5¢/kWh | $196 | +11.9% | +$21/mo |
| 9 | Idaho ID | 13.7¢/kWh | $138 | +11.8% | +$15/mo |
| 10 | Illinois IL | 19.2¢/kWh | $194 | +11.6% | +$20/mo |
Source: U.S. Energy Information Administration (EIA) · Updated monthly · Estimated bill change reflects the rate change only and assumes the same electricity usage in both periods.
The spread between states is the important part of this table. Electricity prices do not move uniformly across the country. A strong national increase can hide much faster increases in some states, while households elsewhere may be seeing relatively little movement.
It is also worth separating percentage change from price level. A state can have one of the fastest increases without having the most expensive electricity in the country. Likewise, an already expensive state can remain expensive even after prices fall.
That distinction is useful when trying to answer two different questions: Where is electricity expensive? and Where is electricity getting more expensive fastest? They are not the same thing.
Where Electricity Prices Fell or Barely Changed
Rising electricity prices are not universal. The other side of the ranking shows states where average residential prices declined or changed relatively little over the same year-over-year period.
| # | State | Current Rate | Est. Monthly Bill | Rate Change | Est. Bill Change |
|---|---|---|---|---|---|
| 1 | Connecticut CT | 24.2¢/kWh | $244 | -12.5% | -$35/mo |
| 2 | Louisiana LA | 12.7¢/kWh | $128 | -3.0% | -$4/mo |
| 3 | Utah UT | 13.1¢/kWh | $132 | -2.5% | -$3/mo |
| 4 | Wyoming WY | 14.4¢/kWh | $145 | -1.9% | -$3/mo |
| 5 | Florida FL | 15.0¢/kWh | $152 | -0.5% | -$1/mo |
| 6 | New Jersey NJ | 25.2¢/kWh | $254 | -0.5% | -$1/mo |
| 7 | Arizona AZ | 15.4¢/kWh | $155 | +0.3% | +$0/mo |
| 8 | North Dakota ND | 13.4¢/kWh | $135 | +0.8% | +$1/mo |
| 9 | Massachusetts MA | 30.5¢/kWh | $307 | +1.4% | +$4/mo |
| 10 | New Mexico NM | 16.1¢/kWh | $162 | +1.8% | +$3/mo |
Source: U.S. Energy Information Administration (EIA) · Updated monthly · Estimated bill change reflects the rate change only and assumes the same electricity usage in both periods.
This is one reason national averages need context. A U.S. average is useful for understanding the overall direction of the market, but it cannot describe what is happening in every state.
Local generation resources, fuel costs, utility investment, weather, regulation and regional grid conditions can all produce very different outcomes from one part of the country to another. The EIA identifies fuel costs, power-plant costs, transmission and distribution infrastructure, weather and regulation among the major factors that affect electricity prices.
Why Are Electricity Prices Rising Faster in Some States?
There is rarely one explanation for a state’s electricity price movement.
The amount households ultimately pay reflects an entire electricity system: generating power, moving it over high-voltage transmission networks, distributing it to homes, maintaining infrastructure and recovering other costs associated with providing electricity.
EIA’s published average retail electricity prices include generation, transmission, distribution, taxes and fees. That means a change in residential electricity prices can result from several forces acting at the same time.
Fuel and generation costs
Power plants have to be built, financed, maintained and operated, and many generators also depend on fuels whose prices change over time.
Natural gas is particularly important because gas-fired power plants often influence wholesale electricity prices. When fuel costs increase, generating electricity can become more expensive. When fuel costs fall or lower-cost generation becomes more available, the pressure can move in the opposite direction.
The generation mix also differs substantially by region. A state with abundant hydropower has a very different cost structure from one that relies heavily on imported fuels or natural gas.
Transmission, distribution and grid investment
Generating electricity is only part of the bill.
Power has to travel from generating facilities through transmission networks and then through local distribution systems before it reaches a home. Those networks require maintenance, repairs, upgrades, cybersecurity investment and new capacity.
EIA notes that electricity prices reflect the costs of building, financing, maintaining and operating both power plants and the grid.
That is also why lower wholesale electricity prices do not automatically mean an immediate drop in residential prices. Retail electricity costs include much more than the price of electricity at a wholesale trading hub.
Weather and electricity demand
Very hot or very cold weather can sharply increase demand as air conditioners or electric heating systems run harder.
Higher demand can increase both electricity and fuel costs, especially when the grid needs more expensive sources of generation to meet peak demand. Weather can also affect supply. Hydropower depends on water availability, while wind and solar generation vary with conditions.
These effects do not necessarily translate into identical price changes in every state because regional grids have different generation resources, capacity constraints and demand patterns.
Regulation and local market structure
Electricity markets are not structured the same way across the United States.
In many areas, retail rates are set through regulated utility processes. Other states allow competitive electricity suppliers to sell power to customers. Costs can also be recovered on different schedules depending on decisions by utilities and state regulators.
As a result, two regions facing similar changes in wholesale electricity costs may not pass those changes through to residential customers at the same time or in the same way.
Are Data Centers Pushing Electricity Prices Higher?
Data centers are now an important part of the electricity-demand story, but they should not be used as a universal explanation for every state where prices are rising.
Large computing facilities consume significant amounts of power and can require new generation, transmission and grid capacity. EIA expects some of the fastest electricity-demand growth from data centers to occur in the PJM and ERCOT grid regions. PJM alone covers all or parts of multiple states in the Mid-Atlantic and Midwest as well as Washington, D.C.
Virginia is an especially clear example of how large computing loads can change regional electricity demand. EIA has documented rapid growth in commercial electricity sales there associated with data centers.
But that does not mean a state appearing near the top of the ranking above can automatically attribute its increase to data centers. Retail electricity prices are affected by many costs, and establishing the cause of a particular state’s change requires more than comparing two monthly EIA values.
I looked at that question separately in Do Data Centers Raise Electricity Bills?, where the focus is specifically on grid demand, infrastructure costs and how those costs can eventually reach residential customers.
Why a Higher Electricity Price Does Not Always Mean the Same Increase in Your Bill
This distinction is easy to miss.
An electricity price is expressed in cents per kilowatt-hour. Your actual monthly bill depends on both the price of electricity and how much electricity you use, along with any additional charges that apply to your utility account.
That means your bill can rise faster than your state’s average electricity price if your consumption also increases. A hotter month, more air-conditioning, electric heating, an EV charger or simply spending more time at home can all change electricity usage.
The reverse is also possible: a higher electricity price does not guarantee a higher bill if you used significantly less electricity.
That is why the Est. Bill Change column in Billora’s ranking deliberately holds electricity consumption constant. It answers a narrow question:
If the household used the same amount of electricity in both periods, what would the change in the average residential electricity price mean in dollars?
It is not a prediction of anyone’s actual utility bill.
If your own bill increased much faster than the state-level price shown here, the next step is to separate the price increase from your usage. I cover that process in Why Is My Electric Bill So High?.
You can also estimate your electricity bill using your home size and household size and compare your state with another state or the national average.
Are Electricity Prices Rising Faster Than Inflation?
In recent years, electricity has behaved differently from many other consumer energy products.
EIA reported that U.S. retail electricity prices had increased faster than overall inflation since 2022 and expected that trend to continue through 2026. One reason is that electricity prices contain costs that do not disappear simply because the price of a fuel falls: utilities still have to invest in generation, transmission and distribution infrastructure and recover those costs over time.
This is also why electricity prices can feel unusually persistent.
Gasoline can respond relatively quickly to movements in crude oil markets. Residential electricity prices often reflect longer-term investment decisions, regulated rate cases, infrastructure projects and regional generation costs.
The comparison is still not identical everywhere. Inflation is a national measure, while electricity markets are strongly regional. The state rankings above provide the more useful answer for someone trying to understand what has actually happened where they live.
Will Electricity Prices Go Down?
They can.
The lower ranking on this page is proof that residential electricity prices do not move upward in every state every year. Changes in fuel costs, generation availability, weather, regulation and utility costs can all lead to periods of lower prices.
A national decline, however, should not be assumed simply because wholesale prices fall in a particular region.
Retail electricity prices include transmission and distribution costs as well as generation costs, taxes and other fees. Utilities are also investing in grid infrastructure while U.S. electricity demand is growing again, including growing demand from large computing facilities.
The most useful approach is therefore to track the data rather than assume prices will move in one direction forever.
This page does exactly that: each new complete monthly EIA dataset can change the ranking.
What Does This Mean for Your Own Electricity Bill?
State averages are useful for understanding the market, but they cannot tell you exactly what your household should be paying.
A two-bedroom apartment and a large detached home in the same state can have completely different electricity consumption. Two neighboring households can also use very different amounts of power depending on cooling, heating, insulation, appliances and daily habits.
Billora’s tables use a standardized household profile so states can be compared on the same basis. For a personal estimate, use the free electricity bill calculator.
Select your state, home size and number of people, then compare the result with another state and the U.S. average. The calculator uses the same EIA residential electricity database as the rankings on this page.
How Billora Calculates Electricity Price Changes
I wanted this ranking to be easy to understand, but also easy to verify. The methodology is deliberately simple:
- Source: U.S. Energy Information Administration residential electricity data.
- Latest data: July 2026.
- Comparison period: the latest complete month is compared with the exact same calendar month 12 months earlier.
- Coverage: all 50 states plus Washington, D.C. are compared using the same two periods.
- Price change: percentage change in the EIA average residential electricity price, expressed in cents per kilowatt-hour.
- Estimated bill: Billora applies the current electricity price to the same standardized household-use model for every state.
- Estimated bill change: electricity consumption is held constant in both periods so the result isolates the impact of the change in electricity price.
The latest EIA monthly values may be preliminary and can later be revised. EIA identifies current Electric Power Monthly figures as preliminary where applicable.
Billora imports fresh EIA data regularly, so the tables and inline values on this page can update without hardcoding a specific month’s prices into the article.
Frequently Asked Questions
Why are electricity prices going up in 2026?
There is no single cause. Residential electricity prices reflect generation and fuel costs, transmission and distribution infrastructure, weather, electricity demand, utility investment and regulatory decisions. The mix of those factors differs by state, which is why some states can experience much larger increases than others.
Which states have the biggest electricity price increases?
The answer changes as new EIA data is published. The live ranking near the top of this page compares the latest complete EIA month with the same month one year earlier and automatically ranks states from the largest percentage increase downward.
Is electricity getting more expensive in every state?
No. Some states can experience flat or declining residential electricity prices even while the national average is increasing. The second live table on this page shows the states with the largest declines or smallest increases in the latest year-over-year comparison.
Why do electricity prices vary so much by state?
States have different generation resources, fuel costs, grid infrastructure, weather patterns and regulatory systems. EIA also notes that the costs of power plants, transmission, distribution and fuels all affect electricity prices, so there is no reason to expect every state to have the same price or trend.
Are electricity prices rising faster than inflation?
EIA has reported that U.S. retail electricity prices increased faster than overall inflation beginning in 2022 and expected that pattern to continue through 2026. The relationship can change over time, however, and state-level electricity trends can differ substantially from the national average.
Will electricity prices go down again?
They can, and some states already show year-over-year declines in the live data above. Whether prices fall in a particular state depends on factors such as generation and fuel costs, infrastructure spending, demand and regulation, so a national trend should not be treated as a prediction for every state.
The Bottom Line
I built this page because a national average alone doesn’t tell the whole story. Once the same EIA data is lined up state by state and compared with the exact same month a year earlier, the differences become much easier to see.
I’ll keep the rankings tied to Billora’s monthly EIA data rather than freezing the article around one set of numbers. If you want to go one step further, use the electricity bill calculator to see what current electricity prices mean for a household like yours.