
Last updated · EIA data through July 2026
When my own utility bill jumped last year, the first thing I did — like a lot of people — was type “is this because of data centers?” into a search bar. The answer turned out to be more interesting than a simple yes or no, and as someone who builds tools with live electricity data, I wanted to lay it out clearly.
Do Data Centers Raise Your Electric Bill? The Short Answer
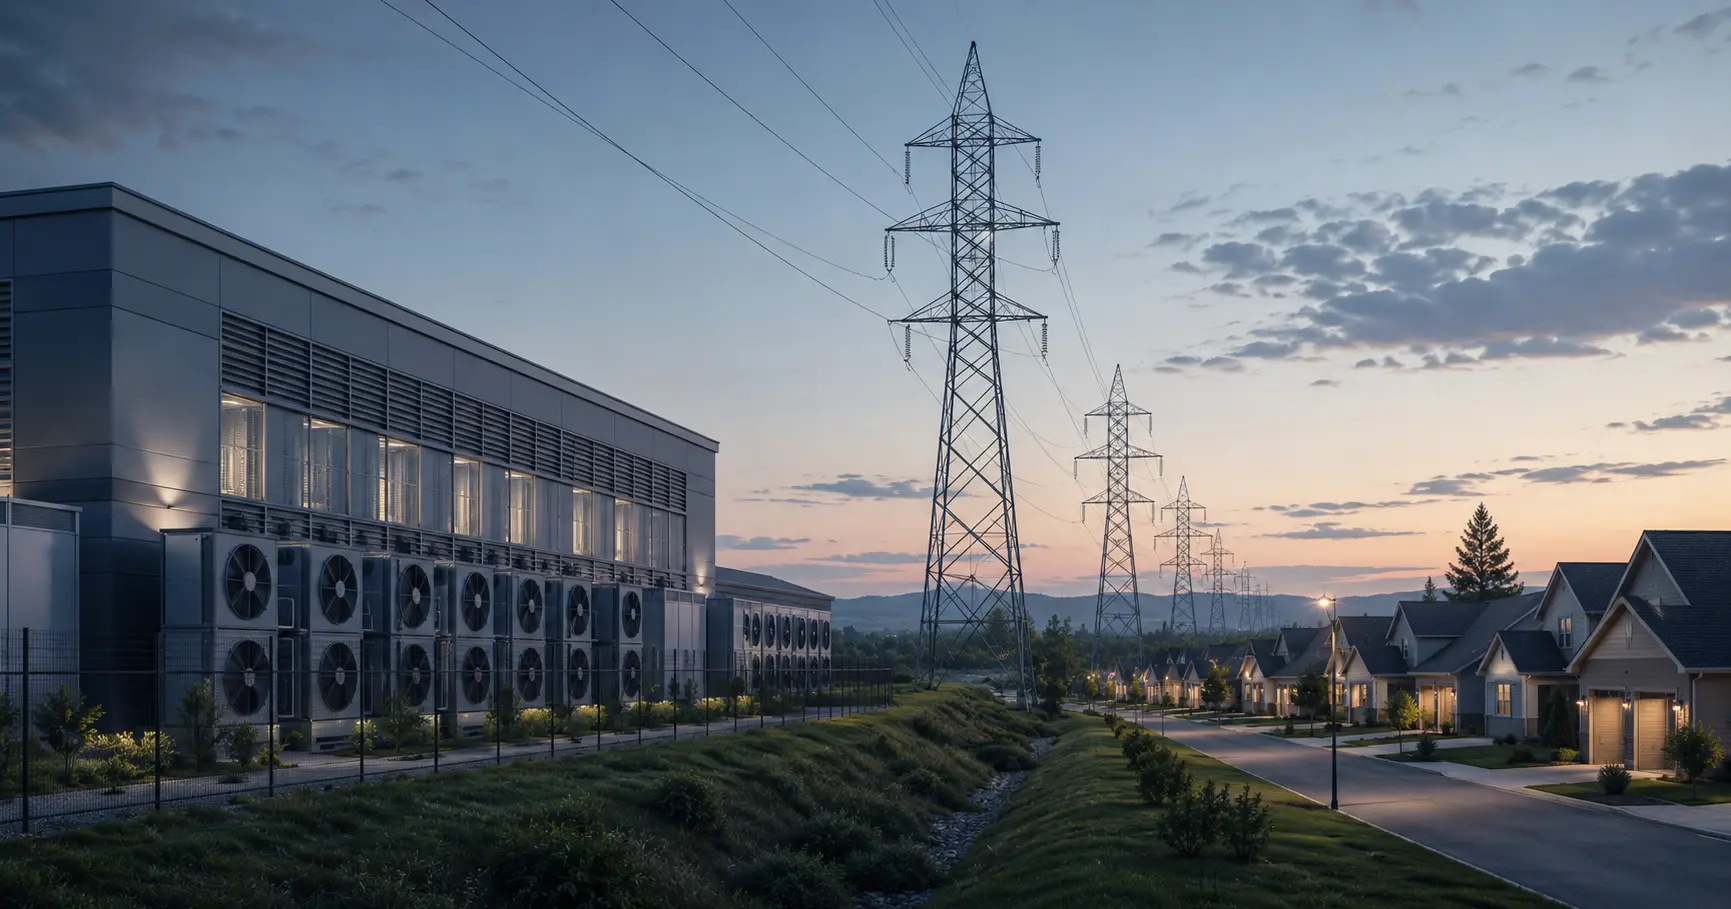
Yes — but indirectly, and the size of the effect depends heavily on which state you live in. Data centers don’t show up as a line item on your bill. Instead, the enormous amount of electricity they demand pushes up shared grid costs — the price of keeping enough power capacity available and the cost of building transmission lines — and those shared costs get spread across all customers, including households.
The clearest way to see how exposed your area might be is to compare a state packed with data centers against one without many. Here’s a live comparison of Virginia — home to the largest concentration of data centers in the world — against a lower-rate neighbor:
(11.2% less)
Source: EIA · Updated monthly
The full ranking of every state by current residential rate looks like this — note where the heavy data-center states land:
| # | State | Avg Rate (¢/kWh) | Est. Monthly Bill |
|---|---|---|---|
| 1 | Hawaii HI | 48.0¢ | $484 |
| 2 | California CA | 33.6¢ | $339 |
| 3 | Maine ME | 32.4¢ | $327 |
| 4 | Massachusetts MA | 30.5¢ | $307 |
| 5 | New York NY | 29.9¢ | $301 |
| 6 | Alaska AK | 28.8¢ | $291 |
| 7 | Rhode Island RI | 28.3¢ | $285 |
| 8 | New Hampshire NH | 26.6¢ | $268 |
| 9 | Washington D.C. DC | 25.2¢ | $254 |
| 10 | New Jersey NJ | 25.2¢ | $254 |
| 11 | Connecticut CT | 24.2¢ | $244 |
| 12 | Vermont VT | 23.8¢ | $239 |
| 13 | Michigan MI | 23.1¢ | $232 |
| 14 | Pennsylvania PA | 21.7¢ | $219 |
| 15 | Maryland MD | 21.4¢ | $216 |
| 16 | Ohio OH | 19.5¢ | $196 |
| 17 | Illinois IL | 19.2¢ | $194 |
| 18 | Wisconsin WI | 19.1¢ | $192 |
| 19 | Delaware DE | 18.5¢ | $186 |
| 20 | Virginia VA | 17.6¢ | $177 |
| 21 | Minnesota MN | 17.5¢ | $176 |
| 22 | Colorado CO | 17.0¢ | $171 |
| 23 | Indiana IN | 16.7¢ | $169 |
| 24 | Alabama AL | 16.4¢ | $165 |
| 25 | Georgia GA | 16.3¢ | $164 |
| 26 | Missouri MO | 16.1¢ | $162 |
| 27 | New Mexico NM | 16.1¢ | $162 |
| 28 | Iowa IA | 16.0¢ | $161 |
| 29 | Oregon OR | 16.0¢ | $161 |
| 30 | Texas TX | 15.9¢ | $160 |
| 31 | West Virginia WV | 15.8¢ | $159 |
| 32 | South Carolina SC | 15.5¢ | $156 |
| 33 | Arizona AZ | 15.4¢ | $155 |
| 34 | South Dakota SD | 15.4¢ | $155 |
| 35 | Kansas KS | 15.3¢ | $154 |
| 36 | North Carolina NC | 15.2¢ | $153 |
| 37 | Florida FL | 15.0¢ | $152 |
| 38 | Montana MT | 15.0¢ | $151 |
| 39 | Washington WA | 14.7¢ | $148 |
| 40 | Mississippi MS | 14.5¢ | $147 |
| 41 | Wyoming WY | 14.4¢ | $145 |
| 42 | Oklahoma OK | 14.4¢ | $145 |
| 43 | Arkansas AR | 14.3¢ | $144 |
| 44 | Kentucky KY | 13.8¢ | $139 |
| 45 | Nebraska NE | 13.8¢ | $139 |
| 46 | Idaho ID | 13.7¢ | $138 |
| 47 | Tennessee TN | 13.7¢ | $138 |
| 48 | North Dakota ND | 13.4¢ | $135 |
| 49 | Utah UT | 13.1¢ | $132 |
| 50 | Nevada NV | 12.8¢ | $129 |
| 51 | Louisiana LA | 12.7¢ | $128 |
| — | US Average | 18.3¢ | $185 |
Source: U.S. Energy Information Administration (EIA) · Updated monthly
These numbers update monthly from the U.S. Energy Information Administration (EIA), so they reflect the most recent published period rather than a figure I typed in once and forgot about.
How a Data Center Actually Pushes Up Residential Rates
A single large data center can draw as much electricity as a small city. When dozens of them cluster in one region, the grid operator has to guarantee enough generating capacity to serve that load at peak demand — and that guarantee is bought through what’s called a capacity market.
Capacity auctions are where the pressure shows up first
PJM Interconnection runs the largest wholesale electricity market in the United States, covering all or part of 13 states plus Washington, D.C. Each year it holds a “capacity auction” to lock in enough power supply for future peak demand. The price of that capacity has exploded. According to PJM and an independent market monitor, the 2025–2026 auction cleared at roughly an 800%+ increase over the prior year, and the monitor attributed about 63% of that increase specifically to data center demand. The following auction for 2026–2027 hit the regulator-approved price cap.
Those capacity costs don’t stay in a spreadsheet. Utilities buy capacity on behalf of their customers, and the bill flows straight through to ratepayers — residential, commercial, and industrial alike.
Transmission and grid build-out add a second layer
Beyond capacity, connecting large new loads requires new substations, transmission lines, and grid upgrades. Under most existing rate structures, those infrastructure costs have historically been allocated across the whole customer base rather than charged solely to the facility that triggered them. That allocation question — who pays for the build-out — is exactly what regulators are now fighting over.
Who pays, and why it varies so much by state
This is the crux. The same data center can have a very different effect on your bill depending on how your state’s regulators allocate the cost. Where rules still spread grid and capacity costs evenly, households absorb a larger share. Where regulators have created special rules for very large customers, more of the cost stays with the data centers themselves. That’s why a state-by-state look matters more than any single national number.
Which States Are Most Exposed
The states feeling the most pressure cluster on the PJM grid and in a few large deregulated markets. Each of the rates below is pulled live, so you’re seeing the current published figure rather than a snapshot:
- Virginia — “Data Center Alley” in Northern Virginia is the densest data-center region on the planet. Current residential rate: 17.6¢/kWh.
- Ohio — A fast-growing PJM hotspot where regulators have already acted on large-load cost recovery. Current rate: 19.5¢/kWh.
- Illinois — Northern Illinois (ComEd territory) sits inside PJM and has seen sharp capacity-driven increases. Current rate: 19.2¢/kWh.
- Texas — On the separate ERCOT grid, with rapid data-center and AI load growth and its own large-load policy debates. Current rate: 15.9¢/kWh.
- Georgia — One of the fastest-growing data-center markets in the Southeast, with utility load forecasts climbing steeply. Current rate: 16.3¢/kWh.
Reporting through 2025 and early 2026 showed residential bills rising faster than the national average in several of these data-center-heavy states. The exact percentages move month to month, which is why I’d rather point you at the live figures above than freeze a number into this paragraph. Want to see your own monthly bill estimate for any of these states? Run it through the calculator here.
What States Are Doing About It
Regulators across the country are responding, and the common thread is shifting more of the cost onto the very large customers that drive it. This is an active, fast-moving area, so treat the specifics below as a dated snapshot rather than a permanent state of affairs.
- Virginia. In November 2025, the State Corporation Commission approved a Dominion Energy rate increase adding about $11.24 per month to a typical residential bill in 2026, with a smaller increase the following year. The same order created a new “GS-5” rate class for customers demanding 25 megawatts or more — effectively most data centers — taking effect January 1, 2027, with minimum-payment requirements designed to insulate households from build-out costs.
- Ohio. Regulators approved a settlement requiring new large data-center customers to pay for a high share of the capacity they request even if they use less, so the cost of dedicated infrastructure stays with them.
- Oregon. Became one of the first states to establish a dedicated rate class for large data-center loads.
- Other states. As of mid-2026, several states have introduced construction moratorium proposals or moved to roll back data-center tax incentives, while legislation in Virginia (such as Senate Bill 253) has proposed shifting more cost from households to data centers.
It’s worth saying plainly: these are documented regulatory decisions, not predictions. The direction of travel — separate rate classes and minimum-demand charges for the biggest users — is consistent across states, even though the dollar figures keep changing.
What It Means for You — and How to Check Your State
If you live in a PJM state or a fast-growing data-center market, some portion of recent rate increases is connected to this demand. If you live in a state with little data-center activity and a different grid, the effect on your bill is likely small. The only way to know where you actually stand is to look at your own state’s current rate and estimated bill — not the national average, which hides enormous variation.
That’s exactly what I built the calculator for. It uses the same live EIA data behind this article, so you can compare your state against any other and see an estimated monthly bill for your home size in a few seconds.
See your state’s real electricity rate
Compare any two states, pick your home size, and get an estimated monthly bill using live government data — free, no signup.
For the bigger picture on what drives bills up generally, my guide on why your electric bill is so high walks through the other major factors, and the average electric bill by state breakdown shows where every state currently ranks.
FAQ
Do data centers directly raise my electricity bill?
Not directly — there’s no data-center line item on your bill. They raise costs indirectly by increasing demand for grid capacity and transmission infrastructure, and those shared costs get spread across all customers, including households.
Which states are most affected by data center electricity demand?
States on the PJM grid see the clearest effect, especially Virginia, Ohio, and Illinois, along with fast-growing markets like Texas (on the ERCOT grid) and Georgia. Virginia’s Northern Virginia region has the world’s largest concentration of data centers.
How much have data centers added to electricity costs?
In PJM’s 2025–2026 capacity auction, an independent market monitor attributed about 63% of a roughly 800%-plus price increase to data center demand. In Virginia, regulators approved a 2026 increase of about $11.24 per month for a typical household, driven in part by this growth.
Are regulators doing anything to protect households?
Yes. Several states have created or proposed special rate classes for very large customers. Virginia’s new “GS-5” class (effective January 2027) and Ohio’s large-load settlement both require big users to cover more of the infrastructure they require, and other states are considering moratoriums or tax-incentive rollbacks.
How can I find out if data centers are affecting my bill?
Check your own state’s current residential rate and how fast it’s been rising. Use the electricity bill calculator to compare your state against others using live EIA data and get an estimated monthly bill for your home size.
Will my bill keep going up because of data centers?
It depends on your state and how its regulators allocate costs. Where new rate classes shift more cost onto data centers, the pressure on household bills eases; where old cost-allocation rules remain, households may keep absorbing a larger share. The trend across states is toward making large users pay more of their own way.
I update this data monthly from the EIA, so the numbers in this article and in the calculator stay current. If you’re worried about a rising bill, start by checking exactly what your state charges — it’s the fastest way to separate the national headlines from your actual situation.
1 thought on “Do AI Data Centers Raise Your Electricity Bill? A State-by-State Look”
Comments are closed.